
In reality, tracking metrics for SaaS marketing can be overwhelming. There are spades of data in the market and numerous tools available; it is easy to get stuck trying to monitor everything at once
That said, success in SaaS marketing is not about tracking all metrics; instead, it is about focusing on the metrics that will genuinely affect your growth. These metrics will help you identify and retain customers, build better strategies, and boost your ROI where it matters. Here’s what I had to tell you. The most critical metrics SaaS businesses should look at in 2025.
What are SaaS Marketing Metrics
SaaS marketing metrics are the key data points that software-as-a-service companies rely on to evaluate the effectiveness of their marketing efforts. These metrics help businesses track performance, identify opportunities, and refine strategies to drive growth and profitability.
Unlike traditional businesses focusing on immediate sales, SaaS companies operate on a subscription-based model, making customer acquisition, retention, and long-term value essential for success.
SaaS marketing metrics go beyond surface-level performance indicators like traffic or clicks—they focus on metrics that directly influence the customer lifecycle, such as cost per acquisition, customer lifetime value, and churn rate.
By leveraging these metrics, SaaS businesses can align their marketing strategies with sales and customer success efforts, ensuring every aspect of the organization contributes to sustainable growth. Ultimately, the goal is not just to attract customers but to foster loyalty and maximize the recurring revenue that fuels long-term scalability.
Over-analyzing data leads to a loss of insight into reality and leads to random decision-making. Marketing strategies must consider changes in consumer behavior. Otherwise, it will be difficult to retain them.
The importance of SaaS marketing metrics
These SaaS Marketing metrics measure customers’ journey from their first introduction to the brand to becoming lifelong loyal customers with full knowledge of how one’s business might optimize through its customer experience. Companies can act based on the metrics captured to achieve refined marketing strategies to ensure they bring customers and keep them.
The key benefit of tracking marketing metrics is that most of these metrics predict future behavior with users. For example, a SaaS business may use these accrued behaviors to enhance the experience and reduce churn risks rather than acting just to acquire new ones. The result is improved revenue and lifetime value for customers.
These metrics also allow organizations to identify new opportunities. For example, launching premium plans or adding features can boost revenue and keep customers engaged. More than 27% of SaaS companies having an Average Revenue Per Account above $500 per month boast a customer retention rate of over 85%; this is evidence that improving the quality offered in the service, as well as user experience, does not only reduce churn but actually builds sustainable customer loyalty.
Top 11 SaaS Marketing Metrics
1. Customer Churn
Monitoring the long-term ties built and maintained by current customers with fresh clients is also imperative. Hence, the churn happening should be monitored. Customer churn rate defines the number of customers lost in a particular time. This important index indicates your business health, showing how well customers tend to hold during given periods.
Instead of merely measuring churn, I would probe deeper into what has driven it. Knowing who the customers are that churn and what the commonality is or what field they are in would help. Share this across all teams, for example, Sales, Marketing, Customer Support, etc., so that some issues can be worked on.
2. Revenue Churn
Revenue churn is a crucial metric for B2B SaaS businesses as it reflects how customer loss impacts your overall revenue. Unlike customer churn, which measures the number of lost customers, revenue churn accounts for the varying amounts of revenue each customer generates.
This is especially important if your subscription pricing is based on the number of seats or users, where some customers contribute more than others. In such cases, revenue churn can give you a clearer understanding of the financial consequences of churn, as it may differ from customer churn.
I track customer and revenue churn to get a full picture of your business’s health. This approach helps me identify significant discrepancies and prevent surprises when analyzing the overall performance.
3. Customer Lifetime Value
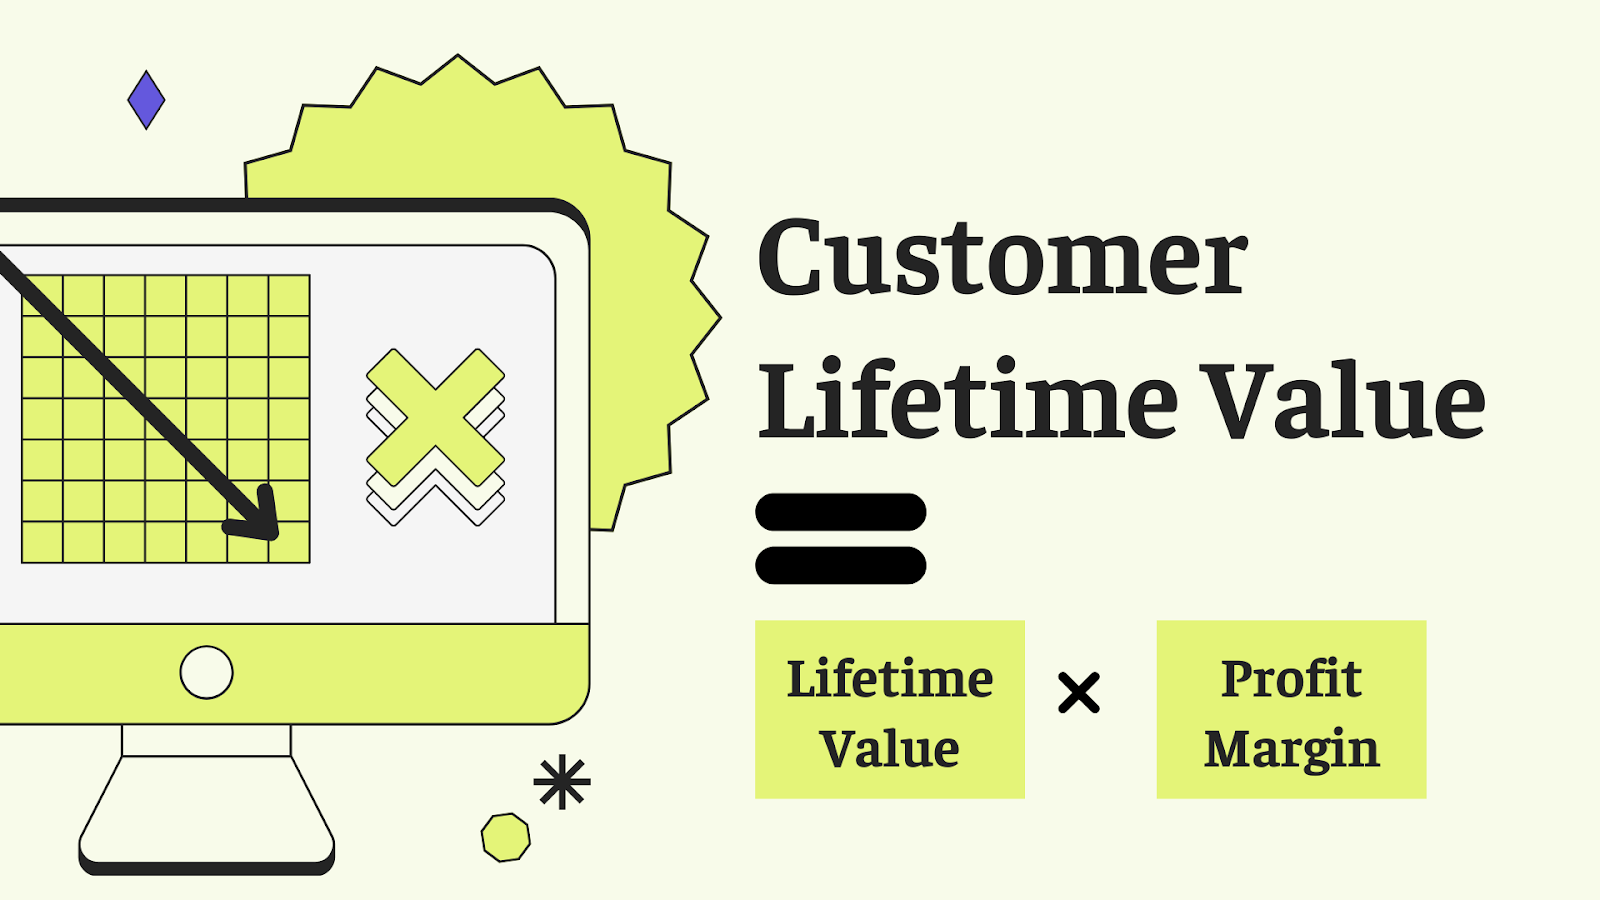
Customer lifetime value is a precious metric that portrays the total revenue a company can expect from a customer throughout their relationship. It allows companies to gauge their long-term growth potential through straightforward calculations of the three steps involved:
The customer lifetime will be calculated by dividing one by your customer churn rate if your churn rate is 1 percent monthly. For example, the customer lifetime would be 100 (1/0.01=100).
The total revenue is divided by the number of customers to find the ARPA, as follows: if your total revenue is $100,000 and you have 100 customers, then your ARPA would be $1,000 ($100,000 / $100 = $1,000).
And then multiply the customer lifetime by the ARPA. In this example, the CLV would be $100,000 ($1,000 times $100 = $100,000).
This metric, therefore, assists in predicting future revenue from existing customers and understanding the cumulative value of each customer relationship over time.
4. Annual Recurring Revenue (ARR)
Annual Recurring Revenue (ARR) is another important performance measure you should watch out for. This is the revenue generated from a customer base that is recurring annually for your business.
And since it measures your business’s total performance, you may use it to forecast revenues for the future and measure growth besides monitoring overall business performance. It is most beneficial for companies that have annual contracts or subscriptions with their customers.
Consider a $10,000 contract per year over five years: the ARR would then be $2,000 a year. Thus, you can calculate ARR by dividing all contract revenue by the number of years for which the customer will be contacted. ARR is applicable for setting yearly revenue goals and checking whether your business is on course to meet those goals, thus adjusting marketing and spending where necessary to enhance revenues.
5. Lead-to-Customer Rate
Within this entry is a score referred to as the lead-to-customer ratio. This is a vital statistic for sales teams that denotes the efficiency of generating sales-ready leads over time. Further, it involves the number of leads that become paying customers.
To compute the necessary lead-to-customer ratio, divide the total number of customers for that month by the number of leads generated during the same period and multiply by 100. For example, if you have a total of 500 leads and you gain only five customers, then the lead-to-customer ratio is simply 1 percent. That tracking will help identify strategies that work for you and those needing reevaluation.
Implement a closed-loop reporting setup to guarantee accurate collection and calculation of this metric. Using integrated solutions such as HubSpot, CRM can quickly determine how many leads and customers it has achieved within a set period. It is essential to identify top-performing campaign modifications in the future and direct future marketing efforts more efficiently.
Expert opinion
Monitoring the health of a SaaS business requires digging into the data to see what’s happening under the hood. But you need to track the right KPIs or risk overlooking flaws in your product and marketing strategy.

6. Customer Engagement Score
A customer engagement score measures customers’ engagement with your brand and services. It helps to track how often customers log in and use your software, along with all other possible behavior indicators that may determine the odds of churn.
So, one customer logs in to your software several times daily. In that case, this customer will likely find your service invaluable and not think about unsubscribing from this software shortly. The customer engagement score differs for all SaaS companies based on how the customer engages with software.
When building your customer engagement score, determine the behavior characteristics of your happiest and most extended customers. Do they log in daily? Do they reach certain markers of usage? When you’ve built a robust engagement profile, attach weights or values to those engagement metrics based on how much influence they’ll have on keeping that customer.
7. CAC: LTV Ratio
The CAC-to-LTV ratio compares your customers’ lifetime value (CLV) to the investment cost of acquiring these customers (CAC). This ratio is necessary to gauge the effectiveness of your marketing campaigns regarding sales because one may easily interpret whether you are spending appropriately to acquire customers while maximizing their value in the long run.
Using CAC-to-LTV ratios allows a business to ascertain whether it is spending much higher costs on customer acquisition than the marketing budget would allow. It will also assist in setting a meaningful budget with the company’s goals and new business revenues.
The general rule of thumb is that for every dollar spent acquiring customers, the value realized over a sufficient duration should be at least three times the CAC. If the ratio lies below 1:1 at any time, then overspending is being incurred with respect to customer acquisition.
However, a ratio of more than 5:1 could indicate the organization is under-investing in customer acquisition when it could use that gap to acquire more customers and/or grow revenues.
8. Customer Acquisition Cost (CAC)
Customer acquisition costs are those costs that represent the expenditure on attracting a new customer and relate to the customer’s value to the business. In addition, CA indicates the cost of acquiring customers to determine how effective and sustainable the business model is when correlated with customer lifetime value.
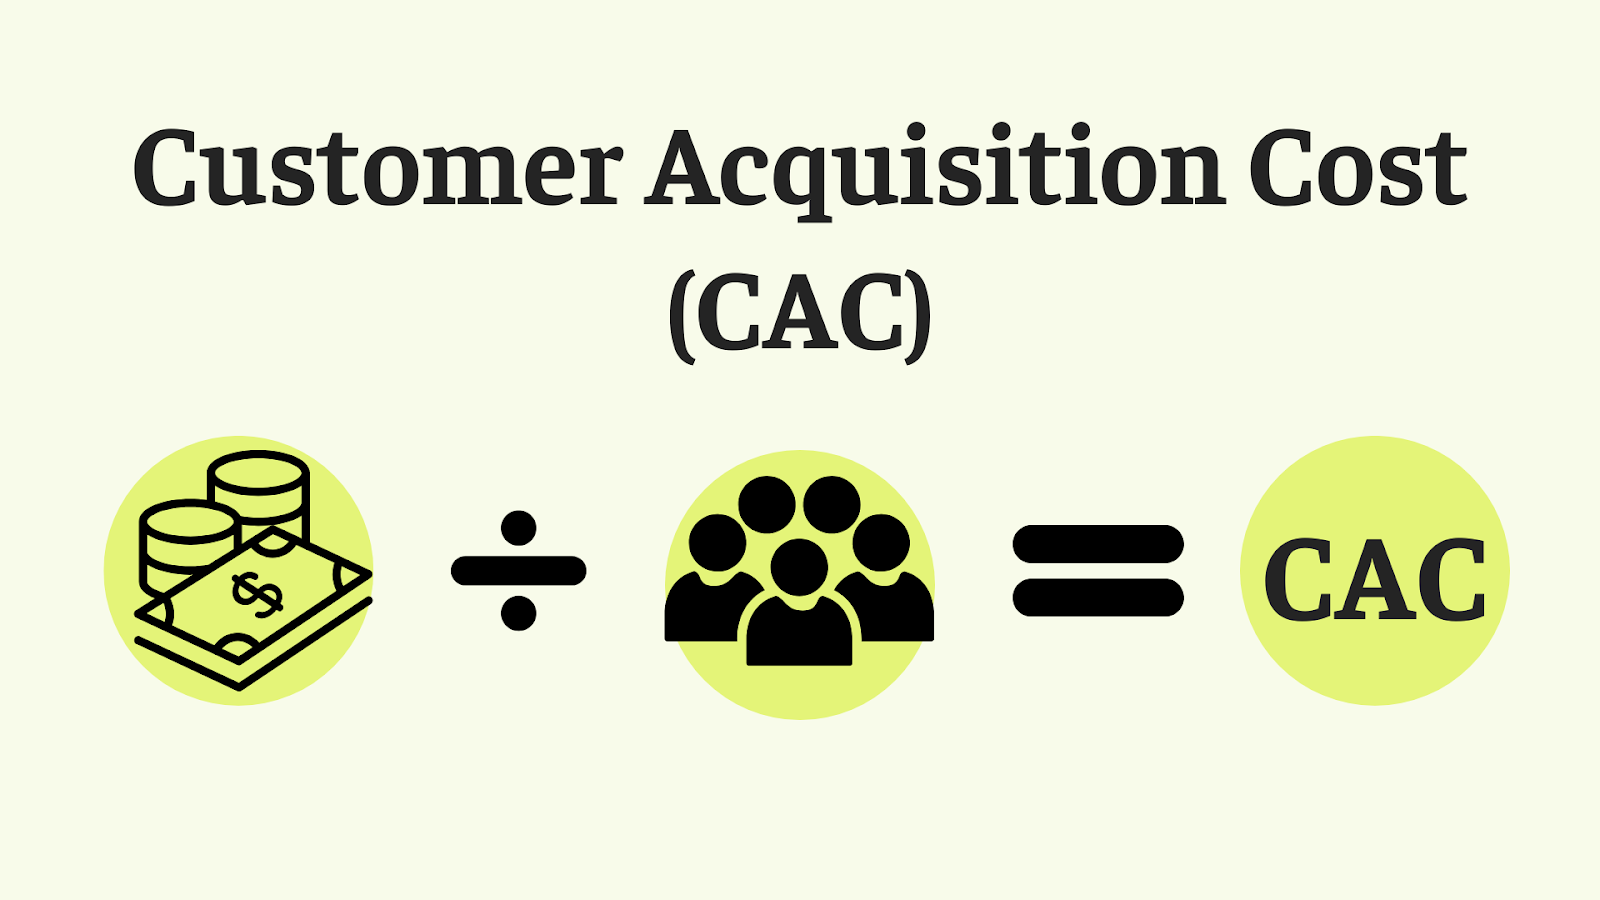
CAC is measured by taking the total costs related to sales and marketing, which consist of salaries, advertising, etc, and dividing it by the number of newly acquired customers in a particular amount of time.
For example, if you spend $100,000 monthly on sales and marketing and form 100 new customers, your CAC will be $1,000 ($100,000 / 100 = $1,000).
By analyzing the cac value of a business, it can effectively assess its organisation’s customer acquisition strategies and thus understand whether a given customer extraction cost is sustainable for the long-term profits sought.
9. Unique Visitor
Unique visitors are those distinct individuals visiting your website in an exact time frame, for example, monthly or yearly. The interpretation distinguishes between the site’s reach from new versus repeat visits in these circumstances. For example, 100K visits may comprise only 10K unique visitors.
The unique visitor count keeps unrealistic expectations from total site visits; so, if a lot of the number of visits is only generated by a small group of people, it would instead lead one to believe that the marketing campaigns are more successful than one might otherwise be led to believe. On the other hand, frequent visits by the same users imply good, engaging content, which makes it likely to influence potential buyers.
10. Qualified Marketing Traffic
Qualified traffic in marketing is traffic that will likely result in customers. This type is well determined by, among other actions, clicking a call-to-action button or reaching a login screen.
Those users are shown to have a clear intent and interest in one’s product or service, which is different from usual site traffic. Such metrics can be tracked through event tracking and in-app analytics, thus focusing business attention on high-potential leads.
The divided leads have entered a standard sales funnel by stage in the buying process. Marketing Qualified Leads (MQL) are prospects who display high interest in your content, such as downloading an ebook or returning to your website. These leads go beyond casual interest and need further nurturing before becoming sales-qualified.
Sales Qualified Lead (SQL) is a subscriber who actively compares vendors and is thus warm for the sales follow-up. Because SQLs are much further along in the decision-making process, they are a priority for sales teams. Proper tracking and identification of MQLs and SQLs allow a business to optimize its resources and efforts toward engaging leads most likely to convert into paying customers.
Conclusion
By 2025, all SaaS companies must embrace marketing analytics, focusing on key metrics associated with customer retention or revenue growth. Customer churn, revenue churn, and gross customer lifetime value are essential to understanding an organization’s health and business decisions. By monitoring these metrics, companies could easily optimize their marketing strategy, decrease churn, and drive long-term profitability.
Lead-to-customer rate and customer engagement score are critical for assessing how well businesses nurture leads and keep customers. This applies to all marketing measures and improvement opportunities that generate more revenues or better prospects to the extent set using corded metrics.
But along with the need to measure the precious few metrics, it’s also worth pointing out the balancing act between that and developing innovative products. Indeed, there would be stifling creativity within an organization if most of its energies were directed toward measuring the success of all its tactics and never ceasing to perform market changes. SaaS marketing success, thus, is not just measuring performance but innovating continuously to produce a better customer experience and, therefore, deliver sustainable and long-term value.
Frequently Asked Questions