General Chatbot Statistics
- 84% of companies believe that AI chatbots will become increasingly crucial for customer communication. (Source: Dashly)
- Business leaders assert that chatbots contribute to a 67% surge in sales. (Source: Dashly)
- In a Gartner survey conducted between December 2022 and February 2023 with 497 B2B and B2C customers, it was discovered that a chatbot’s ability to advance the customer’s issue was the primary factor driving adoption, accounting for 18% of the likelihood for customers to use the chatbot again. (Source: Gartner)
- Resolution rates differ significantly by issue type, with only 17% of billing disputes being resolved by customers interacting with a chatbot during their journey. In contrast, rates for returns or cancellations reached as high as 58%. (Source: Gartner)
- Roughly 53% of survey participants identify extended response times as the most frustrating aspect of engaging with businesses. (Source: Tidio)
- Given the choice between a 15-minute wait for a response, 62% of consumers prefer interacting with a chatbot over a human agent. (Source: Tidio)
- Nearly 9 out of 10 customers engaged in at least one conversation with a chatbot in 2022. (Source: Tidio)
- Approximately 90% of customer inquiries are resolved within 10 messages or less. (Source: Tidio)
- The leading chatbot-utilizing nations include the United States, India, Germany, the United Kingdom, and Brazil. (Source: Tidio)
- In 2023, approximately 1.4 billion individuals were willing to engage with chatbots for communication. (Source: G2)
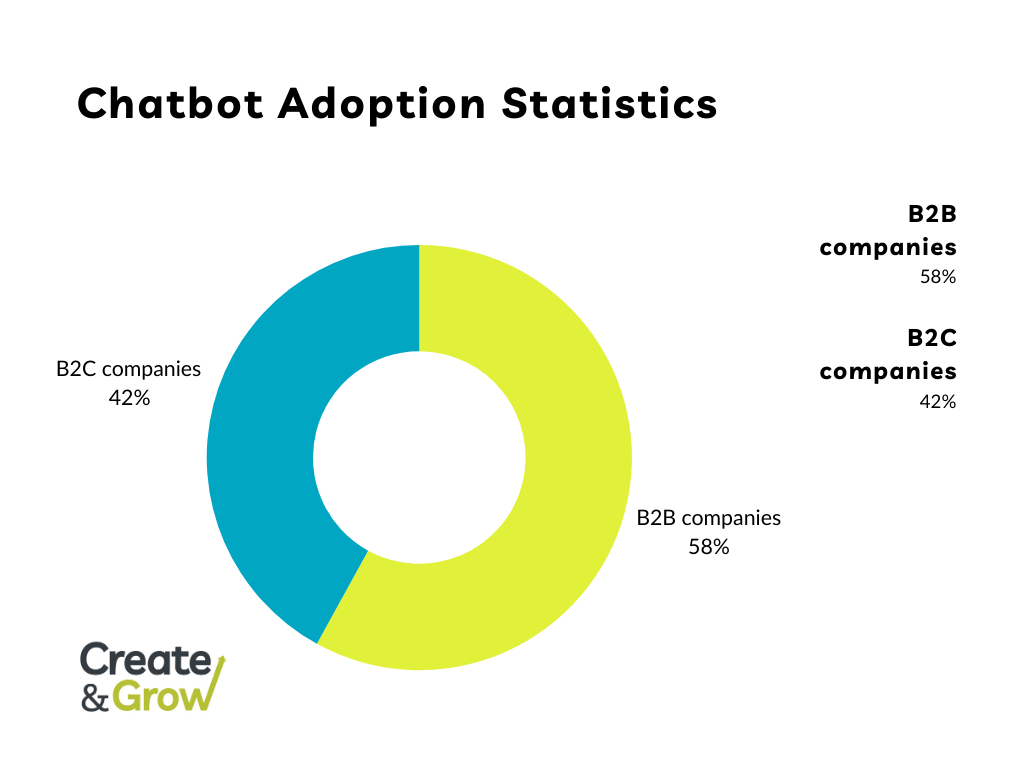
- In 2023, 58% of B2B companies incorporated chatbots into their websites, surpassing the 42% adoption rate observed in B2C organizations. (Source: G2)
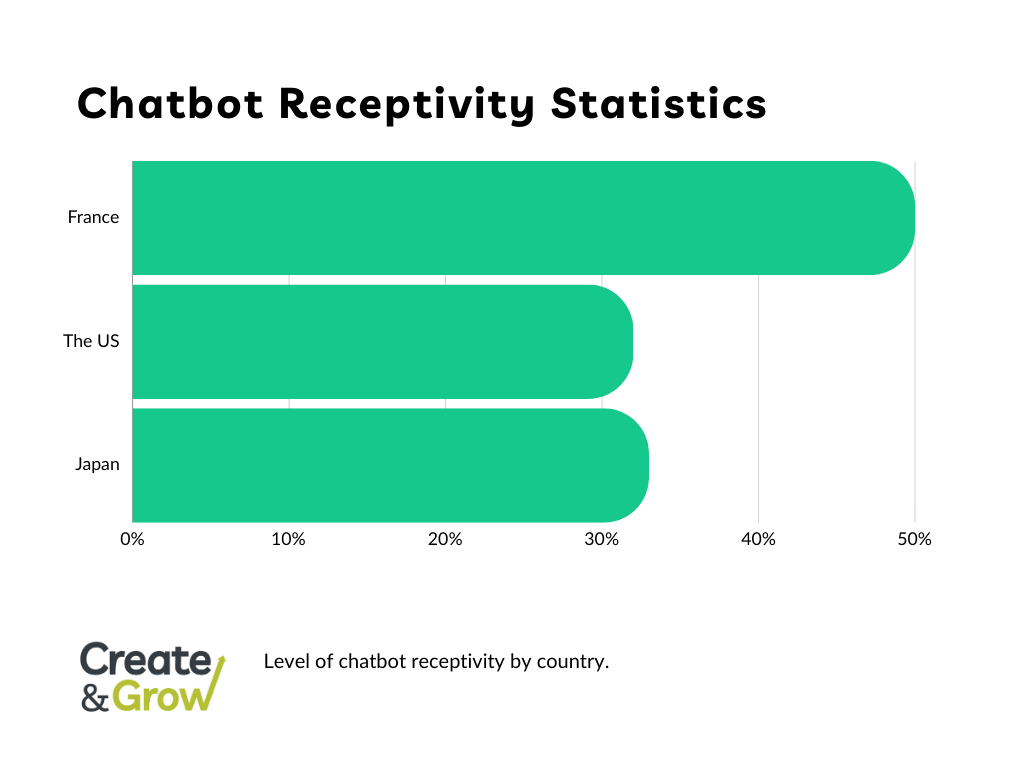
- Europe exhibited a higher preference for chatbots compared to the US and Japan, with a 50% approval rate in France compared to approximately 32-33% in the US and Japan. (Source: G2)
- There has been a 92% increase in the number of websites and applications offering a chatbot experience in recent years. (Source: LocaliQ)
- A total of 68% of individuals find satisfaction in the prompt responses delivered by chatbots. (Source: LocaliQ)
- Close to 90% of individuals engaged in at least one chatbot conversation. (Source: Colorlib)

Chatbot Market Size and Adoption Rate
- In 2023, the chatbot market is expected to witness an increase of more than $994 million, reflecting significant growth at an annual rate of approximately $200 million. (Source: Tidio)
- In 2022, businesses realized cost savings of approximately $11 billion by implementing chatbots, a notable achievement given that chatbots can reduce customer support costs by up to 30%. (Source: Tidio)
- The chatbot market was worth $4.6 billion in 2022 and is projected to achieve a value of $32.4 billion by 2032, with a compound annual growth rate (CAGR) of 21.6%. (Source: Yahoo Finance)
- The chatbot market is projected to reach approximately $1.25 billion in 2025, marking a substantial growth compared to its size of $190.8 million in 2016. (Source: Statista)
- The global chatbot market is categorized into Marketing, Human Intelligence, and Artificial Intelligence segments. Among these, Marketing is expected to hold the most substantial market share, with a projected growth rate of 23.7% by 2030. (Source: What’s the Big Data)
Chatbot Usage and Engagement Statistics
- Daily interaction with digital assistants is a routine for 40% of millennials. (Source: Master of Code)
- Typically, users ask an average of 4 questions during a single chat session with chatbots. (Source: Master of Code)
- A significant 73% of consumers anticipate websites to incorporate digital assistants to facilitate convenient interactions. (Source: Master of Code)
- Bots play a role in 39% of all conversations between businesses and consumers. (Source: Master of Code)
- Response rates vary widely – with more engaging bot experiences achieving impressive 80-90% response rates, while even the less favorable ones still fall within the 35-40% range. (Source: Matthew Barby)
- Effective bots and engaged audiences can yield response rates as high as 90%. (Source: Colorlib)
- A survey of more than 5,000 consumers across six countries revealed that 38% of respondents worldwide had a positive overall perception of chatbots. (Source: Business Insider)
- Just 11% of the global survey respondents expressed a negative perception of chatbots, while the remaining 51% held neutral opinions. (Source: Business Insider)
- France displayed the highest level of receptivity, with 50% of respondents having a positive view of chatbots. On the other hand, respondents from the United States and Japan exhibited the lowest receptivity, with only 32% and 33%, respectively, viewing chatbots positively. (Source: Business Insider)
- Despite the youngest consumer segment valuing the convenience of AI-powered instant messaging, just 44% of Gen Z respondents think that chatbots will render traditional customer support call centers obsolete. (Source: Tidio)
- Approximately 20% of Gen Z shoppers opt to initiate their customer service interactions with chatbots rather than engaging with human agents. This stands in stark contrast to only 4% of boomers, highlighting a substantial disparity. (Source: Tidio)
- Roughly 69% of consumers opt for conversational marketing chatbots because of the quick and efficient way they can initiate contact with a company. (Source: Aspiration Marketing)
- If a company provides support through live chat, 52% of consumers are more inclined to make repeat purchases. (Source: Aspiration Marketing)
- The primary utilization of chatbots was for customer support, with 67% of those surveyed having used a chatbot for customer support in the previous year. (Source: Business Insider)
- Presently, AI chatbots are employed by 23% of customer service companies. (Source: Blogging Wizard)
- The typical chatbot conversation comprises approximately 5.7 messages. (Source: Embryo)
- A total of 24% of companies observed an improvement in their customer support evaluation scores. (Source: Spring Apps)

eCommerce Chatbot Statistics
- AI chatbots can cut the SDR workload in half by addressing client FAQs. (Source: Dashly)
- Utilizing chatbot quizzes for lead qualification yields 20% superior results compared to static forms. (Source: Dashly)
- The primary applications for digital assistants are in sales (41%) and client services (37%), with marketing (17%) being the third most prevalent use case. (Source: Master of Code)
- Currently, 80% of retail and eCommerce businesses are either utilizing AI bots or have plans to implement them soon. (Source: Master of Code)
- eCommerce enterprises that employ chatbots for business communication achieve an average open rate of 85% and a click-through rate (CTR) of 40%. (Source: Master of Code)
- B2B service networks engage with chatbots 58% of the time, while 42% of their consumer networking involves interactions with chatbots. (Source: Service Bell)
- Numerous companies, approximately 39% of them, implement chatbots to establish a more user-friendly environment on their websites. (Source: Service Bell)
- A notable 33% of consumers rate their live chat experience as “very effective” in resolving their issues. (Source: LocaliQ)
- In specific industries, chatbot conversion rates can soar as high as 70% for businesses. (Source: LocaliQ)
- Chatbots segment traffic and employ targeted ads, contributing to 77% of a company’s return on investment (ROI). (Source: Spring Apps)
- Chatbots lead to around 28% of website visitors converting into leads. (Source: Spring Apps)

Chatbots in Social Media
- Just on Facebook Messenger, there are more than 300,000 operational chatbots. (Source: Blogging Wizard)
- A significant 74% of young individuals indicate that their perception of a brand becomes more positive when the business responds to their inquiries on social media. (Source: Embryo)
- 53% of individuals opt to patronize businesses they can engage with through messaging. (Source: Botsurfer)
- A majority of 56% of people prefer sending a message over calling the customer care line. (Source: Botsurfer)
- Monthly, a staggering two billion messages are exchanged between businesses and individuals. (Source: Botsurfer)
Chatbots in Human Resources
- Job-related websites experience a 95% increase in leads when they engage with jobseekers through chatbots. (Source: Tidio)
- For numerous HR departments, bots contribute to the liberation of over 12,000 work hours per year. (Source: Tidio)
- By the year 2023, HR chatbots are expected to handle up to 75% of global HR queries. (Source: Tidio)
- A total of 13% of HR teams have already incorporated chatbots, virtual assistants, or machine learning apps into their processes. (Source: Master of Code)
- A significant 62% of HR professionals lean towards the use of cognitive tools, such as chatbots, to assist with their HR requirements. (Source: Master of Code)
Chatbots in Healthcare
- The healthcare chatbots market is projected to achieve a value of $543 million by the year 2026. (Source: Tidio)
- Approximately 52% of patients in the United States access their health data using healthcare chatbots. (Source: Tidio)
- On a global scale, healthcare chatbots contribute to saving up to $3.6 billion. (Source: Tidio)
- The healthcare chatbots market is anticipated to expand from $0.24 billion in 2023 to $0.99 billion by 2032, demonstrating a compound annual growth rate (CAGR) of 19.5% throughout the forecast period spanning from 2023 to 2032. (Source: Market Research Future)
Chatbots in Finance
- The BFSI (banking, financial services, and insurance) chatbot market is projected to reach approximately $7 billion by the year 2030. (Source: Tidio)
- Utilizing financial services chatbots can lead to time savings of approximately 4 minutes per inquiry for customers, contributing directly to enhanced customer satisfaction. (Source: Tidio)
- A notable 43% of banking customers favor resolving issues through chatbots. (Source: Tidio)
- In the realm of AI, chatbots accounted for 90% of the automation utilized by banks and online banking services in 2022. (Source: Service Bell)
- Roughly 37% of the U.S. population is believed to have engaged with a bank’s chatbot in 2022, and this number is expected to increase in the future. (Source: Consumer Finance)
Chatbot Forecasts and Predictions
- A recent estimate suggests that the global conversational AI market reached nearly $5 billion in 2020 and is expected to grow to $14 billion by 2025, with a compound annual growth rate (CAGR) of 22%. (Source: AI Multiple)
- The chatbot industry is anticipated to expand from $4.92 billion in 2022 to $24.64 billion by 2030, demonstrating a compound annual growth rate (CAGR) of 23.91% throughout the forecast period (2022-2030). (Source: Market Research Future)
- According to Gartner, “Artificial Intelligence (AI) is set to become a common customer experience investment in the coming years.” 47% of organizations will utilize chatbots for customer care, while 40% will implement virtual assistants. (Source: Reve Chat)
Frequently Asked Questions

