Key B2C Marketing Statistics and Facts
- A brand’s revenue shows a 73% correlation with its cultural relevance. (Source: Twitter for Business)
- The primary content publishing platform for 89% of content marketers is their website or blog. (Source: Siege Media)
- Only 22% of B2C marketers refrain from using paid content channels. (Source: CMI)
- On average, B2C organizations allocate 5% to 12% of their revenue towards marketing expenditures. (Source: Search Engine Land)
- Content marketing is outsourced by 55% of B2C marketers. (Source: CMI)
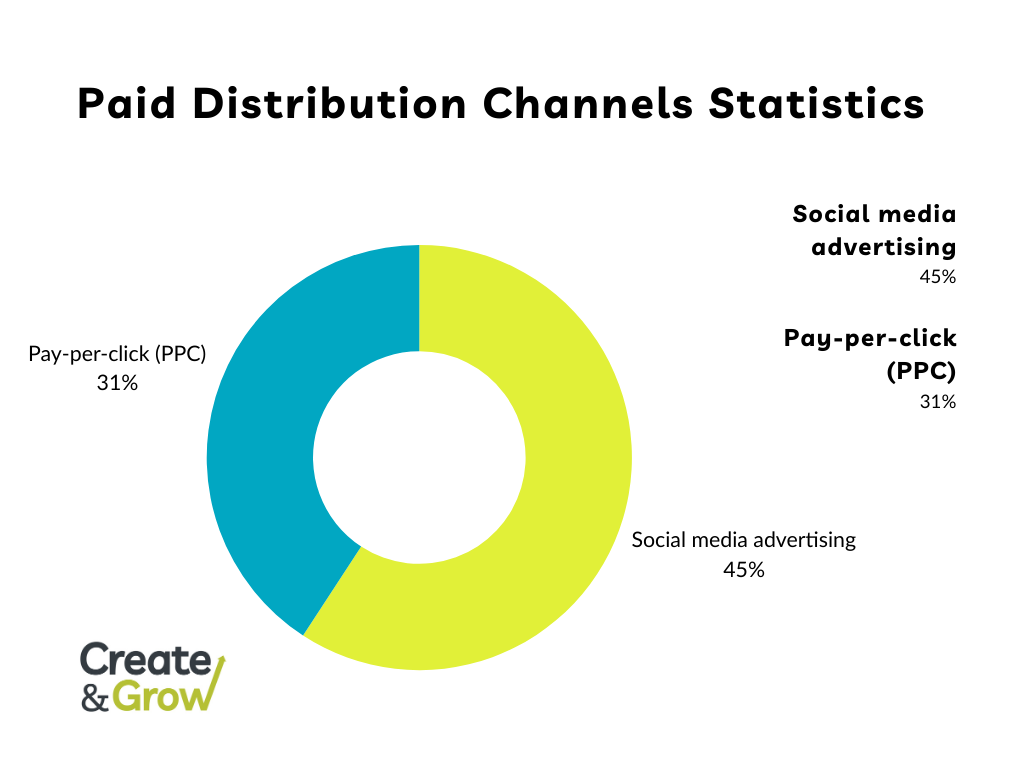
- Among all the paid distribution channels, social media advertising (45%) and pay-per-click (31%) delivered the most effective overall content marketing results. (Source: CMI)

B2C Content Marketing Strategy Statistics
- A content marketing strategy is in place for 70% of B2C respondents’ organizations. (Source: CMI)
- In 2023, 54% of B2C marketers collaborated with creators or influencers, and 49% intend to boost their investments in influencer marketing in 2024. (Source: HubSpot)
- Paid channels are utilized by 78% of content marketers. (Source: CMI)
- In 2023, 61% of businesses were planning to invest in social media or community building. (Source: CMI)
- A content marketing strategy is not in the plans for only 5% of B2C marketers. (Source: CMI)
- In fact, 77% of marketers have witnessed a rise in email engagement in the past 12 months. (Source: HubSpot)
- An impressive 94% of marketers repurpose their content when generating new content. (Source: LinkedIn)
- B2C marketers predominantly use blog posts (83%), followed by email newsletters (74%), videos (62%), and infographics (55%) as their top four types of content. (Source: CMI)

B2C Content Marketing Statistics
Social Media Content Marketing Statistics
- In 2023, 56% of marketers raised their budget allocation for TikTok advertising. (Source: HubSpot)
- As a result of conversations on Twitter, 76% of users made a purchase. (Source: Twitter for Business)
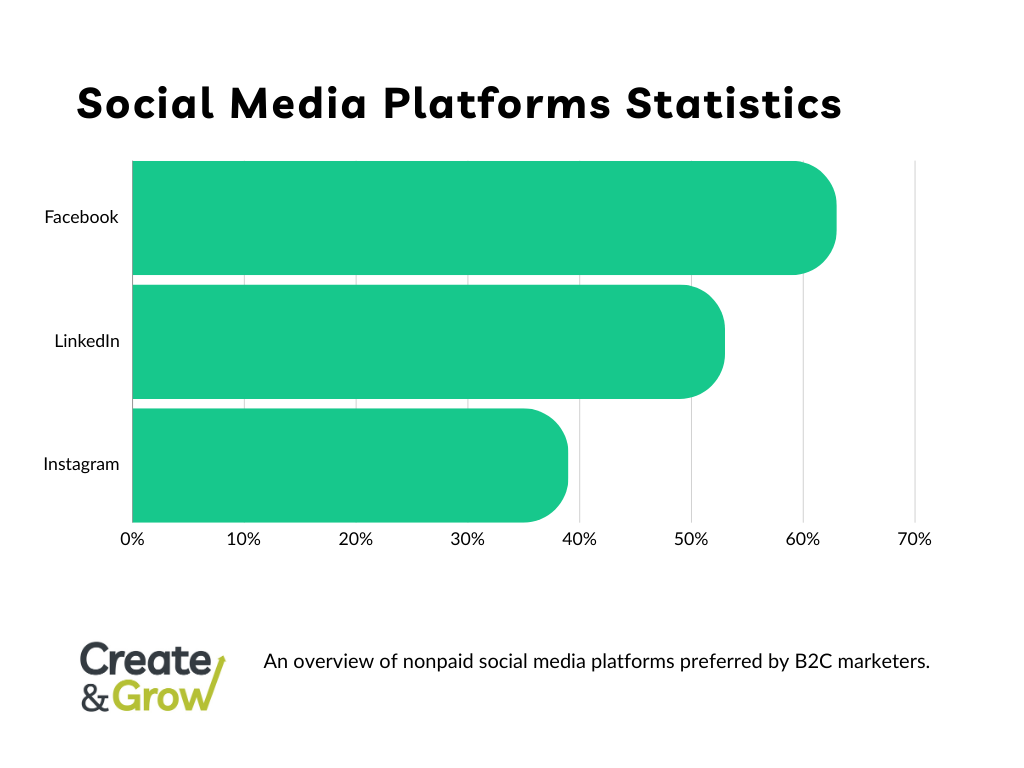
- B2C marketers find the best content marketing results on nonpaid social media platforms with Facebook (63%), LinkedIn (53%), and Instagram (39%). (Source: CMI)
- Before making a purchase, 64% of Twitter users consistently conduct online product research. (Source: Twitter for Business)

Video Content Marketing Statistics
- 69% of marketers have invested funds in video advertising. (Source: Wyzowl)
- 87% of video marketers affirm that video content has directly contributed to an increase in sales. (Source: Wyzowl)
- 39% of video marketers have produced video testimonials, marking it as the most prevalent singular use case for video marketing in 2024. (Source: Wyzowl)
- A 60-second video retains the attention of 66% of viewers until the end. (Source: Vidyard)
- 75% of video marketers report using AI tools to aid in the creation or editing of marketing videos. (Source: Wyzowl)
Podcast Marketing Statistics
- After hearing a podcast ad, 61% of Gen Zers visited a company’s website. (Source: Edison Research)
- At least once a week, 41% of Millennials listen to a podcast. (Source: Jam Street Media)
- In 2023, 47% of individuals aged 13-24, amounting to 24 million Americans, tuned into a podcast within the past month. (Source: Edison Research)
- In fact, 73% of weekly podcast listeners use their smartphones to tune in. (Source: Oberlo)
B2C Email Marketing Statistics
- A majority of respondents, 59%, indicated that marketing emails have an impact on their purchase decisions. (Source: SaleCycle)
- The forecast indicates that the total number of business and consumer emails sent and received per day is expected to exceed 361 billion by the end of 2024. (Source: The Radicati Group)
- Transactional emails typically achieve an average open rate within the range of 80-85%. (Source: Mailgun)
- A brand that offers personalized experiences is more likely to attract purchases, with 80% of customers showing a greater inclination to buy. (Source: Litmus)
B2C Organic Search Statistics
- Keyword research is employed by 73% of B2C marketers to guide content creation. (Source: CMI)
- In 2024, link building has become a greater priority compared to 2023, as only 5.5% of respondents indicate that they will not prioritize it. (Source: Siege Media)
- Interest in interactive content is on the rise, with 62.3% reporting investment in the area, compared to only 36.1% in 2023. (Source: Siege Media)
B2C Marketing Trends
- In 2023, 77% of B2C marketing leaders plan to make investments in video. (Source: CMI)
- Influencer marketing will continue to be a crucial driver of leads and revenue. (Source: HubSpot)
- Social media publishing and analytics is the predominant technology employed by B2C organizations for content marketing, with 82% utilizing it. (Source: CMI)
B2C Marketing Challenges
- Top concerns for B2C marketers include changes to search algorithms, with 64% expressing worry. (Source: CMI)
- Digital fatigue is prompting 47% of individuals to actively seek downtime from internet-enabled devices. (Source: EY Survey)
- Adapting to the ever-changing landscape of consumer behavior stands out as one of the most significant challenges in B2C marketing. (Source: Optimind)
Frequently Asked Questions

