LinkedIn has more than 1.3 billion members and takes 41% of B2B ad budgets, more than any other channel, according to LinkedIn and Dreamdata’s 2026 benchmark report. It is also the only major ad platform where Dreamdata’s B2B customers earned back more than they spent, with a 121% return on ad spend.
The LinkedIn B2B statistics below cover the audience, ad costs, organic content, creators and thought leadership. Every figure links to its original source, and where two sources disagree, we say so.
- Top LinkedIn B2B Statistics for 2026
- LinkedIn User Statistics
- LinkedIn Revenue and Growth
- LinkedIn Advertising Statistics
- B2B Buying Journey Statistics
- LinkedIn Organic Content Statistics
- LinkedIn Creator and Video Statistics
- B2B Thought Leadership Statistics
- What These LinkedIn Statistics Mean for B2B Marketers
- LinkedIn B2B Statistics FAQ
- Related Reading
Top LinkedIn B2B Statistics for 2026
- LinkedIn has more than 1.3 billion members worldwide. (Source: LinkedIn)
- LinkedIn revenue reached $19.8 billion in Microsoft’s fiscal year to June 2026. (Source: LinkedIn, July 2026)
- LinkedIn Marketing Solutions revenue grew 16% year over year in April to June 2026, its seventh straight quarter of double-digit growth. (Source: LinkedIn)
- LinkedIn takes 41% of total B2B ad budgets, up 2 points in a year. (Source: Dreamdata, 2026)
- LinkedIn ads returned 121% on ad spend for B2B companies, against 67% for Google Search and 51% for Meta. (Source: Dreamdata)
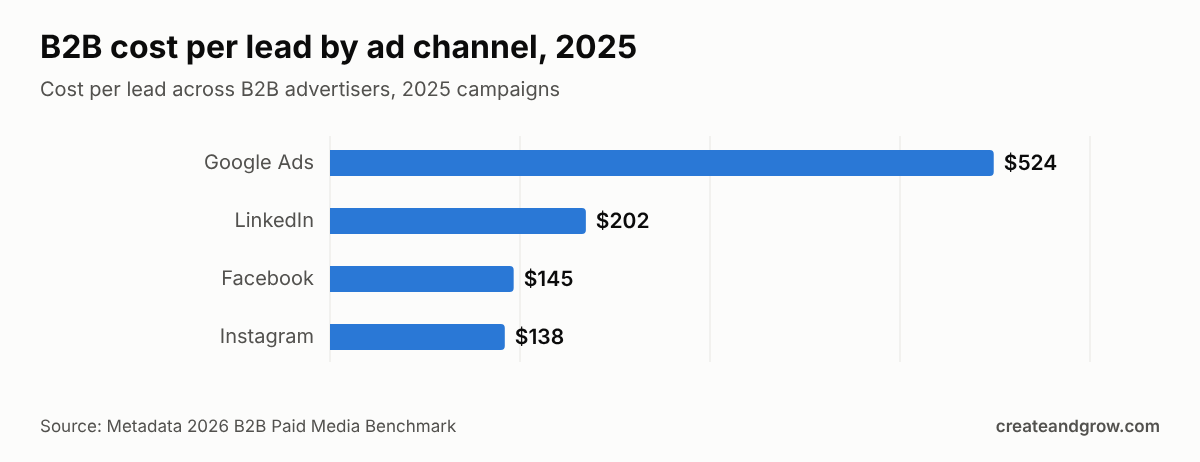
- A B2B lead from LinkedIn ads cost $202 in 2025, at $9.39 per click. (Source: Metadata)
- Native document posts are the most engaging organic format on LinkedIn, at a 7.00% engagement rate. (Source: Socialinsider)
- 82% of B2B marketers who work with creators say influencer campaigns are essential to deliver measurable ROI. (Source: LinkedIn and YouGov, 2026)
- 81% of the B2B customer journey now happens before a deal enters the sales pipeline, up from 70% a year earlier. (Source: Dreamdata)
- Nearly 1 in 5 closed B2B deals (17.9%) involved someone from the buying committee seeing the seller’s LinkedIn Company Page. (Source: Dreamdata)
LinkedIn User Statistics
| Region | LinkedIn members |
|---|---|
| Europe, Middle East and Africa | 430 million+ |
| Asia Pacific | 410 million+ |
| North America | 290 million+ |
| South and Central America | 226 million+ |
| Worldwide | 1.3 billion+ |
- Global membership has grown at a double-digit rate for five years in a row. (Source: LinkedIn)
- Almost 100% of Fortune 500 companies are on LinkedIn. (Source: LinkedIn)
- Every minute on LinkedIn, members view more than 1.8 million feed updates and make more than 18,000 connections. (Source: LinkedIn)
- Every minute, about 8,200 job applications are submitted and 93 people add a new role to their profile. (Source: LinkedIn)
- LinkedIn is available in 36 languages and has more than 17,000 full-time employees. (Source: LinkedIn)
Note that 1.3 billion is registered members, not monthly active users. LinkedIn does not publish a global active-user figure.
LinkedIn Revenue and Growth
- LinkedIn earned $19.8 billion in Microsoft’s fiscal year 2026, which ended June 30, 2026. (Source: LinkedIn)
- Revenue grew 12% year over year in April to June 2026. (Source: LinkedIn)
- Marketing Solutions, LinkedIn’s ad business, grew 16% in that quarter, and Premium subscriptions also grew at a double-digit rate. (Source: LinkedIn)
- Paid video ads on LinkedIn grew 26% year over year. (Source: LinkedIn)
- Time spent on content grew 10%, knowledge-oriented posts grew 24% and time spent reading comments rose 18% year over year. (Source: LinkedIn)
- Recruiters at more than 20,000 companies use LinkedIn’s AI hiring tools, and seats grew 140% in one quarter. (Source: LinkedIn)
LinkedIn Advertising Statistics
Metadata’s 2026 B2B Paid Media Benchmark covers 153 B2B advertisers and $57.6 million of 2025 ad spend, with pipeline and revenue traced back to the ads.
| Channel | Cost per lead | Cost per click | CPM | Click-through rate |
|---|---|---|---|---|
| $202 | $9.39 | $63.19 | 0.67% | |
| $145 | $1.95 | $15.50 | 0.79% | |
| $138 | $2.82 | $18.25 | 0.65% | |
| Google Ads | $524 | $9.76 | $617.91 | 6.33% |
Cost per lead by format
- Document ads produced the cheapest LinkedIn leads, at $142, against $200 for image ads, $265 for video and $362 for conversation ads. (Source: Metadata)
- Document ads also converted 11.9% of clicks into leads, about double the channel average of 5.9%. (Source: Metadata)
- LinkedIn’s native Lead Gen Forms cost $193 per lead, while sending the click to a landing page cost $346, or 79% more. (Source: Metadata)
- LinkedIn retargeting cost more per lead ($234) than prospecting cold audiences ($194). (Source: Metadata)
Pipeline and revenue
- Every $1 spent on LinkedIn lead generation sourced $10.20 of pipeline, against $7.97 across all channels. (Source: Metadata)
- 19.5% of LinkedIn-sourced opportunities that closed were won, and each customer cost $58,572 in ad spend. (Source: Metadata)
- For companies with fewer than 200 employees, a LinkedIn-sourced customer cost $30,739. (Source: Metadata)
- LinkedIn ads returned 121% on ad spend in 2025, up from 113% in 2024; top-performing advertisers reached 279%. (Source: Dreamdata)
- LinkedIn’s cost per company influenced fell to €70.11 from €154, below Google Search (€110.37) and Meta (€128.70). (Source: Dreamdata)
- LinkedIn’s average CPC was €5.98, against €1.60 on Meta. (Source: Dreamdata)
- Sending CRM pipeline data back to LinkedIn through its Conversions API cut cost per acquisition by 20% and raised attributed revenue by 31%. (Source: Dreamdata)
Where the data disagrees
Metadata publishes $202 as LinkedIn’s cost per lead in two places but describes it differently. Its blog calls it a median across advertisers, while its LinkedIn cost page calls it a spend-weighted figure and puts the true median advertiser at $376, with the top quarter under $196 and the bottom quarter above $658. (Source: Metadata) If your cost per lead is between $200 and $400, you are close to typical.
B2B Buying Journey Statistics
- 81% of the B2B customer journey happens outside the sales pipeline, up from 70% a year earlier. (Source: Dreamdata)
- B2B buyers now have an average of 88 touchpoints (up from 76), across four channels, with 10 stakeholders involved (up from 6.8). (Source: Dreamdata)
- The average time from a first LinkedIn ad impression to closed revenue is 281 days. (Source: Dreamdata)
- LinkedIn ads account for 24.2% of sessions at the MQL stage, 30.2% at SQL and 28.3% at new business. (Source: Dreamdata)
- LinkedIn Company Page impressions appear in 9.4% of MQLs, 15% of SQLs and 17.9% of closed deals; the average time from that first organic impression to revenue is 90 days. (Source: Dreamdata)
- Budgets for non-branded search fell from 37% to 33%, as their CPCs rose 29% and click-through rates fell 26%. (Source: Dreamdata)
More data on how businesses buy is in our B2B marketing statistics.
LinkedIn Organic Content Statistics
Socialinsider analysed 1.3 million posts from 16,645 LinkedIn business pages. Engagement rate here means reactions, comments and shares divided by impressions.
| Post format | Engagement rate 2024 | Engagement rate 2025 |
|---|---|---|
| Native document | 6.10% | 7.00% |
| Multi-image | 6.60% | 6.45% |
| Video | 5.60% | 6.00% |
| Image | 4.85% | 5.30% |
| Text | 4.00% | 4.50% |
| Poll | 4.40% | 4.20% |
| Link | 3.30% | 3.25% |
- The average engagement rate for LinkedIn business posts is 5.20%. (Source: Socialinsider)
- Video views per post fell 36% year over year across every page size. (Source: Socialinsider)
- Brands raised their posting of images from 5 to 7 a month and doubled video posts from 2 to 4 a month. (Source: Socialinsider)
- Follower growth slowed: pages with 1,000 to 5,000 followers grew 24.5% in 2025 (40.75% in 2024), while pages with 100,000 to 1 million grew just 6.4%. (Source: Socialinsider)
- Link posts are the weakest format, which matches the advice to put the value in the post rather than behind a click. (Source: Socialinsider)
LinkedIn Creator and Video Statistics
LinkedIn’s 2026 Global B2B Marketing Outlook, run by YouGov, surveyed 1,299 B2B marketers in the US, UK, France, Germany and India in January and February 2026.
- 82% of B2B marketers who work with creators say influencer campaigns are essential to deliver measurable ROI. (Source: LinkedIn and YouGov)
- 81% of B2B marketers who use creators say pulling back from them would mean leaving revenue on the table. (Source: LinkedIn and YouGov)
- 56% of B2B buyers who use creators rely on their input in the final stage of the buying process. (Source: LinkedIn and YouGov)
- 81% of B2B CMOs believe video speeds up sales cycles compared with other formats, and 79% say it speeds up lead conversion. (Source: LinkedIn and YouGov)
B2B Thought Leadership Statistics
Edelman and LinkedIn have run their B2B Thought Leadership Impact Report for seven years. The 2025 edition surveyed nearly 2,000 professionals, including “hidden buyers” who influence purchases without signing off on them.
- 86% of hidden decision-makers say they want bold ideas that challenge their assumptions. (Source: Edelman, 2025)
- In the 2024 edition, 52% of decision-makers said they spend an hour or more a week reading thought leadership. (Source: LinkedIn and Edelman, 2024)
- 75% said a piece of thought leadership led them to research a product they were not considering. (Source: LinkedIn and Edelman, 2024)
- 9 in 10 said they are more receptive to outreach from companies that consistently publish high-quality thought leadership. (Source: LinkedIn and Edelman, 2024)
- 70% of C-suite leaders said thought leadership at least occasionally made them question an existing supplier. (Source: LinkedIn and Edelman, 2024)
- Only 15% rated the thought leadership they read as very good. (Source: LinkedIn and Edelman, 2024)
Original data is what makes thought leadership stand out: 55% of decision-makers named strong research as a top quality marker. (Source: LinkedIn and Edelman) See our content marketing statistics and digital PR statistics for how brands turn research into coverage.
What These LinkedIn Statistics Mean for B2B Marketers
- Judge LinkedIn on pipeline, not cost per lead. It is the dearest social channel per lead but sourced the most pipeline per dollar in Metadata’s data.
- Use Lead Gen Forms and document ads. Both cut cost per lead sharply in 2025.
- Post documents and image sets organically. They lead engagement, while link posts trail.
- Keep your Company Page active. Nearly one in five closed deals involved a Company Page impression.
- Work with creators and executives. Buyers lean on trusted voices at the final decision stage.
For outreach, compare the best LinkedIn automation tools and our list of outreach tools. If you want your brand mentioned by the sites and creators your buyers read, see our brand mention service.
LinkedIn B2B Statistics FAQ
How many people use LinkedIn in 2026?
LinkedIn has more than 1.3 billion members, including 290 million in North America and 430 million across Europe, the Middle East and Africa. That counts registered members, not daily or monthly active users, which LinkedIn does not publish.
How much does a LinkedIn lead cost for B2B?
Metadata’s 2025 data puts LinkedIn at $202 per lead and $9.39 per click. The median advertiser paid $376. Document ads ($142) and native Lead Gen Forms ($193) produced the cheapest leads, while conversation ads cost the most at $362.
Is LinkedIn advertising worth it for B2B?
For most B2B companies, yes. Dreamdata found LinkedIn returned 121% on ad spend, against 67% for Google Search and 51% for Meta, and Metadata found it sourced $10.20 of pipeline per dollar. Leads cost more, but more of them turn into revenue.
What type of LinkedIn post gets the most engagement?
Native document posts, the swipeable PDF carousels, averaged a 7.00% engagement rate in 2025, according to Socialinsider. Multi-image posts followed at 6.45% and video at 6.00%. Link posts had the lowest engagement, at 3.25%.
Related Reading