
The median email open rate was 43.46% in 2025, and the median click rate was 2.09%, across 3.6 million campaigns analysed by MailerLite. Open rates look healthy partly because Apple Mail Privacy Protection marks many emails as opened automatically, so clicks, conversions and revenue are the numbers to watch.
The email marketing statistics below cover benchmarks, ROI, deliverability, automation and AI. Every figure links to its original source, with the year the data covers.
- Top Email Marketing Statistics for 2026
- Email Marketing Benchmarks
- Email Marketing ROI Statistics
- Email Deliverability Statistics
- Email Automation Statistics
- AI in Email Marketing
- Why Open Rates Are Less Reliable
- What These Email Statistics Mean for Your Program
- Email Marketing Statistics FAQ
- Related Reading
Top Email Marketing Statistics for 2026
- The median email open rate was 43.46% in 2025, up from 42.35% in 2024. (Source: MailerLite)
- The median click rate was 2.09% and the click-to-open rate 6.81%. (Source: MailerLite)
- Unsubscribe rates more than doubled, from 0.08% to 0.22%, after Gmail made one-click unsubscribing easier. (Source: MailerLite)
- 87.2% of email reached the inbox worldwide, with 6.1% landing in spam and 6.6% going missing. (Source: Validity, 2026)
- 35% of marketing leaders get $10 to $36 back for every $1 spent on email, and 30% get $36 to $50. (Source: Litmus, 2025)
- Advanced AI adopters are 75% more likely to achieve an email ROI above 45:1. (Source: Litmus State of Email 2026)
- 78% of email teams now produce and send an email in three days or less, against 2024, when 62% took two weeks or more. (Source: Litmus)
- Automated ecommerce emails were 2% of sends but drove 30% of email revenue in 2025. (Source: Omnisend)
- An automated email earned $2.87 on average, against $0.18 for a scheduled campaign. (Source: Omnisend)
- Welcome emails averaged an 83.63% open rate in GetResponse’s 2024 benchmark. (Source: GetResponse)
Email Marketing Benchmarks
MailerLite’s benchmarks cover more than 3.6 million campaigns sent from 181,000 accounts between December 2024 and November 2025, and use median values.
| Metric | 2024 | 2025 |
|---|---|---|
| Open rate | 42.35% | 43.46% |
| Click rate | 2.00% | 2.09% |
| Click-to-open rate | 5.63% | 6.81% |
| Unsubscribe rate | 0.08% | 0.22% |
Benchmarks by industry
| Industry | Open rate | Click rate |
|---|---|---|
| Non-profit | 52.38% | 2.90% |
| Health and fitness | 47.81% | 1.45% |
| Consulting | 45.96% | 2.41% |
| Authors | 43.14% | 2.75% |
| Software and web apps | 39.31% | 1.15% |
| Ecommerce | 32.67% | 1.07% |
- Open rates by industry ranged from 30.10% (travel and transportation) to 55.71% (religion). (Source: MailerLite)
- Click rates by industry ranged from 0.83% to 4.90%. (Source: MailerLite)
- Hobbies (53.25%) and non-profits (52.38%) followed religion as the industries with the highest open rates. (Source: MailerLite)
Benchmarks by region
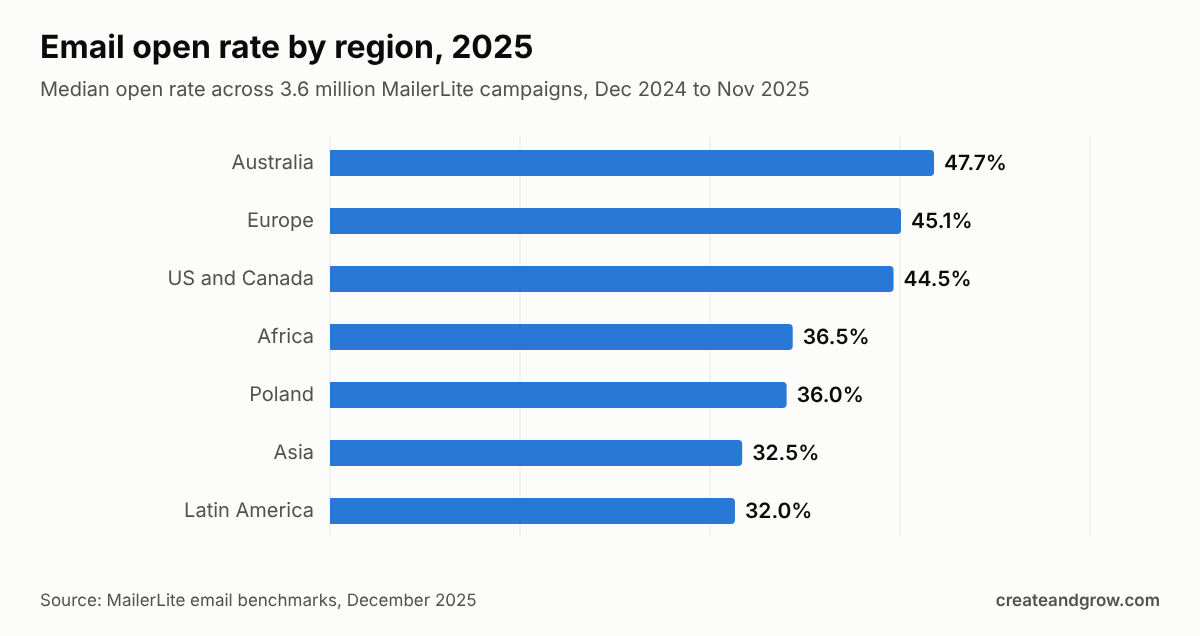
Regions with high iPhone ownership, such as Australia and North America, record higher open rates partly because Apple Mail Privacy Protection counts emails as opened automatically. (Source: MailerLite)
Email Marketing ROI Statistics
- 35% of marketing leaders get $10 to $36 for every $1 spent on email, 30% get $36 to $50 and 5% get more than $50. (Source: Litmus State of Email 2025)
- 21% of marketing leaders do not measure email ROI at all, down from 36% in 2023. (Source: Litmus)
- The top 8% of email programs, those with 45:1 ROI or better, most often send newsletters and onboarding emails. (Source: Litmus)
- Newsletter sends rose 12% in 2026 compared with 2025. (Source: Litmus)
- Use of multi-channel attribution and MQLs to measure email rose 22% year over year, as teams move away from open rates. (Source: Litmus)
- By industry, Litmus has measured email ROI of 45:1 in retail and ecommerce, 42:1 for agencies, 36:1 in software and 32:1 in media. (Source: Litmus, 2020 survey data)
The widely quoted “$36 for every $1” figure comes from Litmus survey data, not a measured average across all senders. Treat it as a ballpark, not a target.
Email Deliverability Statistics
Validity’s 2026 Email Deliverability Benchmark covers more than 2.5 billion mailboxes. Inbox placement rate is the share of email that reached the inbox, not just the receiving server.
| Region | Inbox placement | Spam | Missing |
|---|---|---|---|
| Europe | 91.1% | 3.7% | 5.1% |
| South America | 88.0% | 4.1% | 7.8% |
| Oceania | 87.9% | 3.8% | 8.3% |
| North America | 86.7% | 6.8% | 6.5% |
| Asia | 86.4% | 2.4% | 11.2% |
| Global | 87.2% | 6.1% | 6.6% |
- Global inbox placement rose 3.7% year over year. (Source: Validity)
- Transportation had the best inbox placement of any industry, at 97.2%, followed by energy and utilities (95.0%) and telecommunications (92.6%). (Source: Validity)
- Finance was the most improved sector year over year. (Source: Validity)
- Bounce rates averaged 2.33% and spam complaints stayed below 0.01% in GetResponse’s 2024 data. (Source: GetResponse)
Email Automation Statistics
Omnisend’s 2025 ecommerce data shows automated emails, such as welcome, cart abandonment and back-in-stock messages, earn far more per send than campaigns.
- Automated emails were 2% of email sends but drove 30% of email revenue, earning 16 times more per send than scheduled campaigns. (Source: Omnisend)
- Automated emails reached a 38% open rate, against 30.7% for campaigns. (Source: Omnisend)
- Campaign open rates rose for the fifth year in a row, from 26.6% in 2024 to 30.7% in 2025, even as click rates fell. (Source: Omnisend)
- Click-to-conversion rates rose 53%, from 5.9% to 9%: fewer people clicked, but those who did were more likely to buy. (Source: Omnisend)
- Back-in-stock emails had the highest conversion rate of any automation, at 6.46%. (Source: Omnisend)
- Games (15.1%), food and drink (14.9%) and health (14.8%) had the highest click-to-conversion rates. (Source: Omnisend)
- Triggered emails averaged a 45.38% open rate and 5.02% click rate in 2024, against 40.08% and 3.84% for newsletters. (Source: GetResponse)
AI in Email Marketing
- Advanced AI adopters are 75% more likely to achieve email ROI above 45:1. (Source: Litmus)
- 36% of high-ROI email teams report advanced AI adoption. (Source: Litmus)
- Advanced AI adopters are 54% more likely to follow WCAG accessibility standards and 52% more likely to comply with the European Accessibility Act. (Source: Litmus)
- In 2024, 62% of teams took two weeks or more to produce one email; in 2026, 78% take three days or less. (Source: Litmus)
Where the data disagrees
Litmus gives two figures for the same 2026 finding: 78% of teams send an email in three days or less on its report page, and 76% on its State of Email overview. (Source: Litmus) Both come from the same survey of 500 marketers in the US, UK, Australia and New Zealand, so the difference is likely rounding or a different base.
Why Open Rates Are Less Reliable
- Apple Mail Privacy Protection marks emails as opened automatically, so real open rates are lower than dashboards show. (Source: MailerLite)
- Bot activity also inflates engagement, which is why top teams track revenue per email, list churn and lifetime value instead. (Source: Litmus)
- Emails with preheader text averaged a 44.67% open rate, against 39.28% without one. (Source: GetResponse, 2024)
- Image-based emails had a 4.84% click rate, against 1.64% for text-only emails. (Source: GetResponse, 2024)
What These Email Statistics Mean for Your Program
- Judge email on clicks and revenue. Opens are inflated by privacy features and bots.
- Build automations before more campaigns. They are a tiny share of sends but a large share of revenue.
- Send a newsletter people want. The highest-ROI programs lean on newsletters and onboarding emails.
- Protect deliverability. Roughly one email in eight never reaches the inbox.
- Clean your list. Easier unsubscribes mean disengaged contacts leave on their own; let them.
Compare tools in our guide to the best email marketing platforms and the best AI email assistants. For inspiration, see these SaaS newsletter examples, or join our own Create & Grow newsletter.
Email Marketing Statistics FAQ
What is a good email open rate in 2026?
Anything above about 43% is above the median. MailerLite’s 2025 benchmark across 3.6 million campaigns put the median open rate at 43.46%, with industries ranging from 30.10% to 55.71%. Because Apple Mail Privacy Protection inflates opens, compare click rates too.
What is a good email click rate?
MailerLite’s median click rate in 2025 was 2.09%, and the median click-to-open rate was 6.81%. Click rates ranged from 0.83% to 4.90% by industry. Non-profits (2.90%) and authors (2.75%) were well above average, ecommerce (1.07%) below.
What is the ROI of email marketing?
In Litmus’s 2025 survey, 35% of marketing leaders reported $10 to $36 back per $1 spent, and 30% reported $36 to $50. That is why “$36 per $1” is often quoted. Teams using AI heavily were 75% more likely to exceed 45:1 in 2026.
What percentage of emails reach the inbox?
Globally, 87.2% of email reached the inbox in Validity’s 2026 benchmark, with 6.1% going to spam and 6.6% missing entirely. Europe had the best inbox placement at 91.1%, and Asia the most missing email at 11.2%.
Related Reading