Private B2B SaaS companies grew at a median of 22% in 2025, down from 25% in 2024, according to SaaS Capital’s survey of more than 1,000 companies. Software spending is still rising fast, but more of it goes to AI features, price increases and fewer, bigger platforms, so the average SaaS company has to work harder for each dollar.
The SaaS statistics below cover growth, retention, AI, spending and how buyers choose software. Every figure links to its original source, with the year the data covers.
- Top SaaS Statistics for 2026
- SaaS Growth Statistics
- SaaS Retention and Churn Statistics
- AI and SaaS Statistics
- SaaS Spending Statistics
- How Buyers Choose SaaS in 2026
- What These SaaS Statistics Mean for Marketers
- SaaS Statistics FAQ
- Related Reading
Top SaaS Statistics for 2026
- Median growth for private B2B SaaS companies was 22% in 2025, down from 25% in 2024. (Source: SaaS Capital, 2026)
- Median year-over-year recurring revenue growth fell to 14% in Q2 2026, from 41% in Q4 2022. (Source: ChartMogul)
- Median gross revenue retention dropped from 88% to 84% in 2025. (Source: Benchmarkit via The SaaS CFO)
- AI-native startups grow about three times faster than other B2B SaaS companies at the same revenue stage. (Source: High Alpha and Kyle Poyar, 2025)
- Organizations in Zylo’s dataset spend an average of $55.7 million a year on SaaS, up 8% year over year. (Source: Zylo, 2026)
- Spend on AI-native apps jumped 108% in a year, and 393% in large enterprises. (Source: Zylo)
- Gartner expects worldwide software spending to grow 15.1% in 2026. (Source: Gartner via Campus Technology)
- 82% of B2B software buyers sourced recommendations from an AI chatbot in the last two years. (Source: G2, 2026)
- 49% of software buyers say their CFO reversed an already approved deal in the last 12 months. (Source: G2)
- The median free-to-paid conversion rate across 200 software products is 8%. (Source: ChartMogul, 2026)
SaaS Growth Statistics
SaaS Capital’s 15th annual survey covers more than 1,000 private B2B SaaS companies and reports full-year 2025 growth.
| Company type | 2024 median growth | 2025 median growth |
|---|---|---|
| All companies | 25% | 22% |
| Bootstrapped | 23% | 20% |
| Equity-backed | 25% | 25% |
- 7.3% of companies reported flat or negative growth in 2025, up from 6.9% the year before but well below the 13% peak of 2020. (Source: SaaS Capital)
- The median company falls from 65% growth to 28% within a year, and only 18% of startups keep or improve their growth rate. (Source: ChartMogul Growth Decay Report, 2026)
- Top-quartile growth for startups under $1M ARR climbed back to 300% year over year, from 150% in 2023 and 250% in 2024. (Source: High Alpha and Kyle Poyar)
- Nearly half of software startups reach $1M ARR within 10 years, but only 1 in 10 reach $10M and 1 in 50 reach $25M. (Source: ChartMogul, 2025)
- Only 3.3% of startups that reach $1M ARR get there in under 12 months; the typical path takes two to five years. (Source: ChartMogul)
- Companies that start with customers paying $300 to $2,999 a month grow 3 to 5 times faster than those starting with smaller or much larger customers. (Source: ChartMogul, 2026)
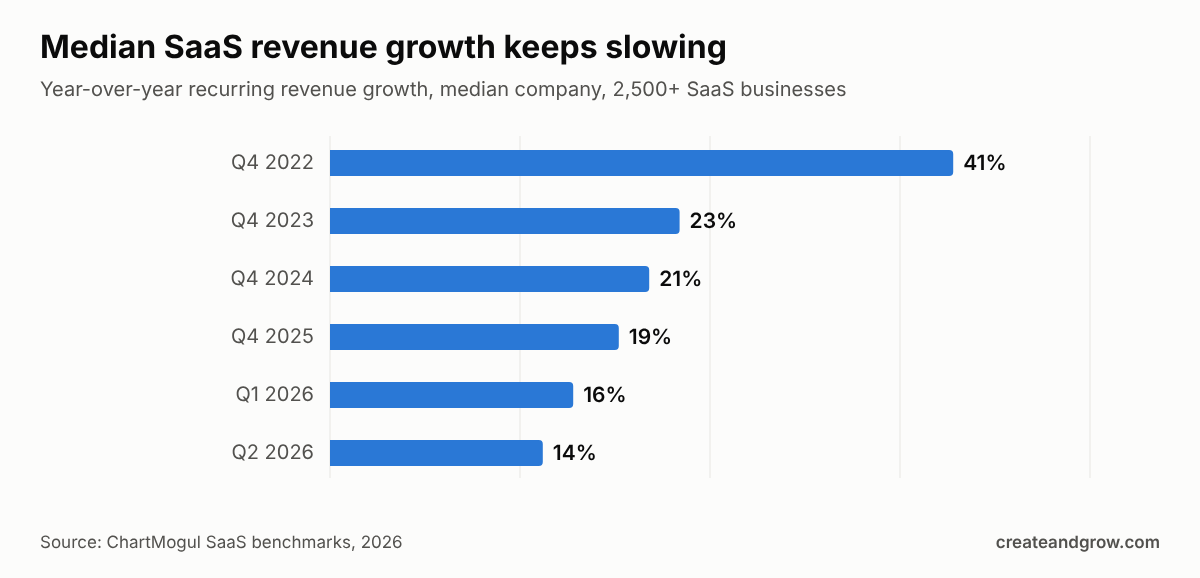
In ChartMogul’s data, the top quarter of companies grew 70% in Q2 2026, while the bottom quarter shrank by 12%. (Source: ChartMogul)
SaaS Retention and Churn Statistics
- Raising net revenue retention (NRR) from the 90-100% range to 100-110% adds about 5 percentage points of growth. (Source: SaaS Capital)
- Companies with the highest NRR grow at a median rate 173% higher than the overall median. (Source: SaaS Capital)
- Median gross revenue retention (GRR) fell from 88% to 84% in Benchmarkit’s 2026 report. (Source: The SaaS CFO)
- 40% of net new ARR at the median company now comes from expansion rather than new customers. (Source: Benchmarkit via The SaaS CFO)
- Companies with high NRR and a short CAC payback period averaged 71% growth; those with low NRR and long payback averaged 10%. (Source: High Alpha and Kyle Poyar)
- Companies that grew from $1M to $20M ARR raised their NRR by 12% along the way. (Source: High Alpha and Kyle Poyar)
- Customers add seats at nearly 10 times the rate in their first month as in month 11. (Source: ChartMogul, 2026)
- 40% of first-year plan upgrades happen in month 12, at renewal. (Source: ChartMogul)
- 45% of customers who come back after cancelling return within 30 days, and 66% within 90 days. (Source: ChartMogul Winbacks Report, 2026)
- The cheapest quarter of signups keeps 74% of customers after 12 months, against 45% for the most expensive quarter. (Source: ChartMogul LTV Report, 2026)
AI and SaaS Statistics
High Alpha and Kyle Poyar surveyed more than 800 B2B software companies in August and September 2025 for the 2025 SaaS Benchmarks Report.
| ARR band | AI-native median growth | B2B SaaS median growth |
|---|---|---|
| Under $1M | 100% | 75% |
| $1M to $5M | 110% | 40% |
| $5M to $20M | 90% | 30% |
| $20M to $50M | 60% | 35% |
| Over $50M | 40% | 15% |
- 70% of software companies have launched AI features, and another 22% have them on the roadmap. (Source: High Alpha and Kyle Poyar)
- 36% say AI is core to their product; 64% say it is a supporting feature. (Source: High Alpha and Kyle Poyar)
- AI is core to three in four startups founded in 2022 or later. (Source: High Alpha and Kyle Poyar)
- Gross margins for early-stage companies fell nearly 10 points in a year, likely because of AI costs. (Source: High Alpha and Kyle Poyar)
- SaaS products see nearly 3 times the plan upgrade rate of AI-native products, but nearly 10% of AI customers reactivate after cancelling. (Source: ChartMogul, 2026)
- Use of apps in the AI category grew 181%, the fastest growth in Zylo’s dataset. (Source: Zylo)
SaaS Spending Statistics
| Metric (Zylo 2026) | Value |
|---|---|
| Average annual SaaS spend | $55.7M |
| Median annual SaaS spend | $20.6M |
| Average number of apps | 305 |
| Median number of apps | 240 |
- Average SaaS spend rose 8% year over year while the number of apps barely moved, down 0.07%. (Source: Zylo)
- In large enterprises, annual SaaS spend rose about 16% year over year. (Source: Zylo)
- 78% of IT leaders reported unexpected charges tied to AI features or usage-based pricing, and 61% cut projects because of unplanned SaaS cost increases. (Source: Zylo)
- In Zylo’s data, 46% of SaaS licenses go unused at the average company, worth $19.8M a year. (Source: Zylo)
- Gartner forecasts worldwide IT spending of $6.31 trillion in 2026, up 13.5%, with software growing 15.1%. (Source: Gartner via Campus Technology, May 2026)
- In its February 2026 forecast, Gartner put 2026 software spending above $1.4 trillion, after 11.5% growth in 2025. (Source: SaaStr)
How Buyers Choose SaaS in 2026
G2’s 2026 Buyer Behavior Report, published in July 2026, surveyed more than 1,000 B2B software buyers and decision-makers.
- Evaluation is now the longest stage of the buying journey for 40% of buyers, ahead of research (36%). (Source: G2)
- IT security review is the biggest delay after choosing a vendor (39%), rising to 50% for enterprise buyers. (Source: G2)
- Finance involvement in software decisions jumped from 31% to 46% in one year. (Source: G2)
- 70% of buyers say the pace of AI is pushing them toward shorter contracts. (Source: G2)
- Preference for outcome-based pricing doubled from 11% to 23%, and 52% say variable pricing improved their view of a vendor. (Source: G2)
- 84% of buyers consolidated at least three tools into all-in-one platforms in the last year. (Source: G2)
- 51% of B2B software buyers start research with an AI chatbot more often than with Google, up from 29% a year earlier. (Source: G2, April 2026)
- 85% of buyers think more highly of a vendor when an AI chatbot includes it in an answer. (Source: G2)
- At some software companies, traffic from ChatGPT converts 6 times better than traffic from Google. (Source: ChartMogul Conversion Report, 2026)
- Trials that require a credit card convert 5 times better than those that do not. (Source: ChartMogul)
Where the data disagrees
Growth figures differ by source. SaaS Capital puts 2025 median growth at 22% (Source: SaaS Capital), while ChartMogul shows 19% for Q4 2025 and 14% by Q2 2026 (Source: ChartMogul). SaaS Capital surveys private B2B companies about their full year; ChartMogul measures billing data from a wider mix that includes smaller and consumer subscription businesses.
G2 also changed its own finding within a few months. In April 2026 it said AI chatbots were the top source shaping shortlists (Source: G2); in July, review sites (38%) edged ahead of AI chatbots (37%) (Source: G2). The two sources are now close to level.
What These SaaS Statistics Mean for Marketers
- Retention is the growth lever. Expansion now brings in about 40% of new ARR at the median company.
- Show up in AI answers. Most software buyers now start or shape shortlists with chatbots.
- Keep review profiles strong. Review sites still shape shortlists as much as AI does.
- Build a CFO-ready case. Finance now sits in almost half of software decisions.
- Pitch upgrades early. Seat growth peaks in the first month.
Track the right numbers with our guide to SaaS marketing metrics, and see how organic search pays off in SaaS SEO ROI. To get cited by AI tools, start with our SaaS SEO guide and our research on llms.txt adoption among SaaS companies. For AI search trends, see our AI search statistics.
SaaS Statistics FAQ
What is a good SaaS growth rate in 2026?
A private B2B SaaS company growing faster than 22% a year beats the median, based on SaaS Capital’s survey of more than 1,000 companies for 2025. Small companies should grow much faster: High Alpha found a 75% median for B2B SaaS under $1M ARR.
What is a good net revenue retention rate?
Above 100% means existing customers grow revenue on their own. SaaS Capital found that moving NRR from 90-100% to 100-110% adds about 5 points of growth, and companies with the highest NRR grow 173% faster than the median.
How much do companies spend on SaaS?
Zylo’s 2026 index, based on the companies it tracks, puts average annual SaaS spend at $55.7 million, up 8% in a year, with a median of $20.6 million. The average company runs 305 apps, and spend is rising mostly through AI features and price changes rather than more apps.
Do software buyers use AI to choose SaaS?
Yes. G2 found that 82% of B2B software buyers sourced recommendations from an AI chatbot in the last two years, and 51% start research with a chatbot more often than with Google. Review sites still matter just as much for shortlists.
Related Reading